
It’s been a while since I have written a blog post about my home server. I’ve been working away on my personal project for a while now, adding more features and more integrations – cool ways to make data do cool things.
I recently had a power outage at my apartment. I keep my server on an uninterruptible power supply to ensure that I don’t lose any data. I also keep my modem and router on the UPS but typically when the apartment loses power, the internet goes down as well. This means my server isn’t accessible – and the external services I’ve configured to depend on it may have a service interruption.
I could use a cloud service like Uptime Robot to check if my services are currently functional and up – it would automatically check if my service is accessible from the view of a third party. These cloud-hosted products cost money and are against my ethos of self-hosting everything I can.
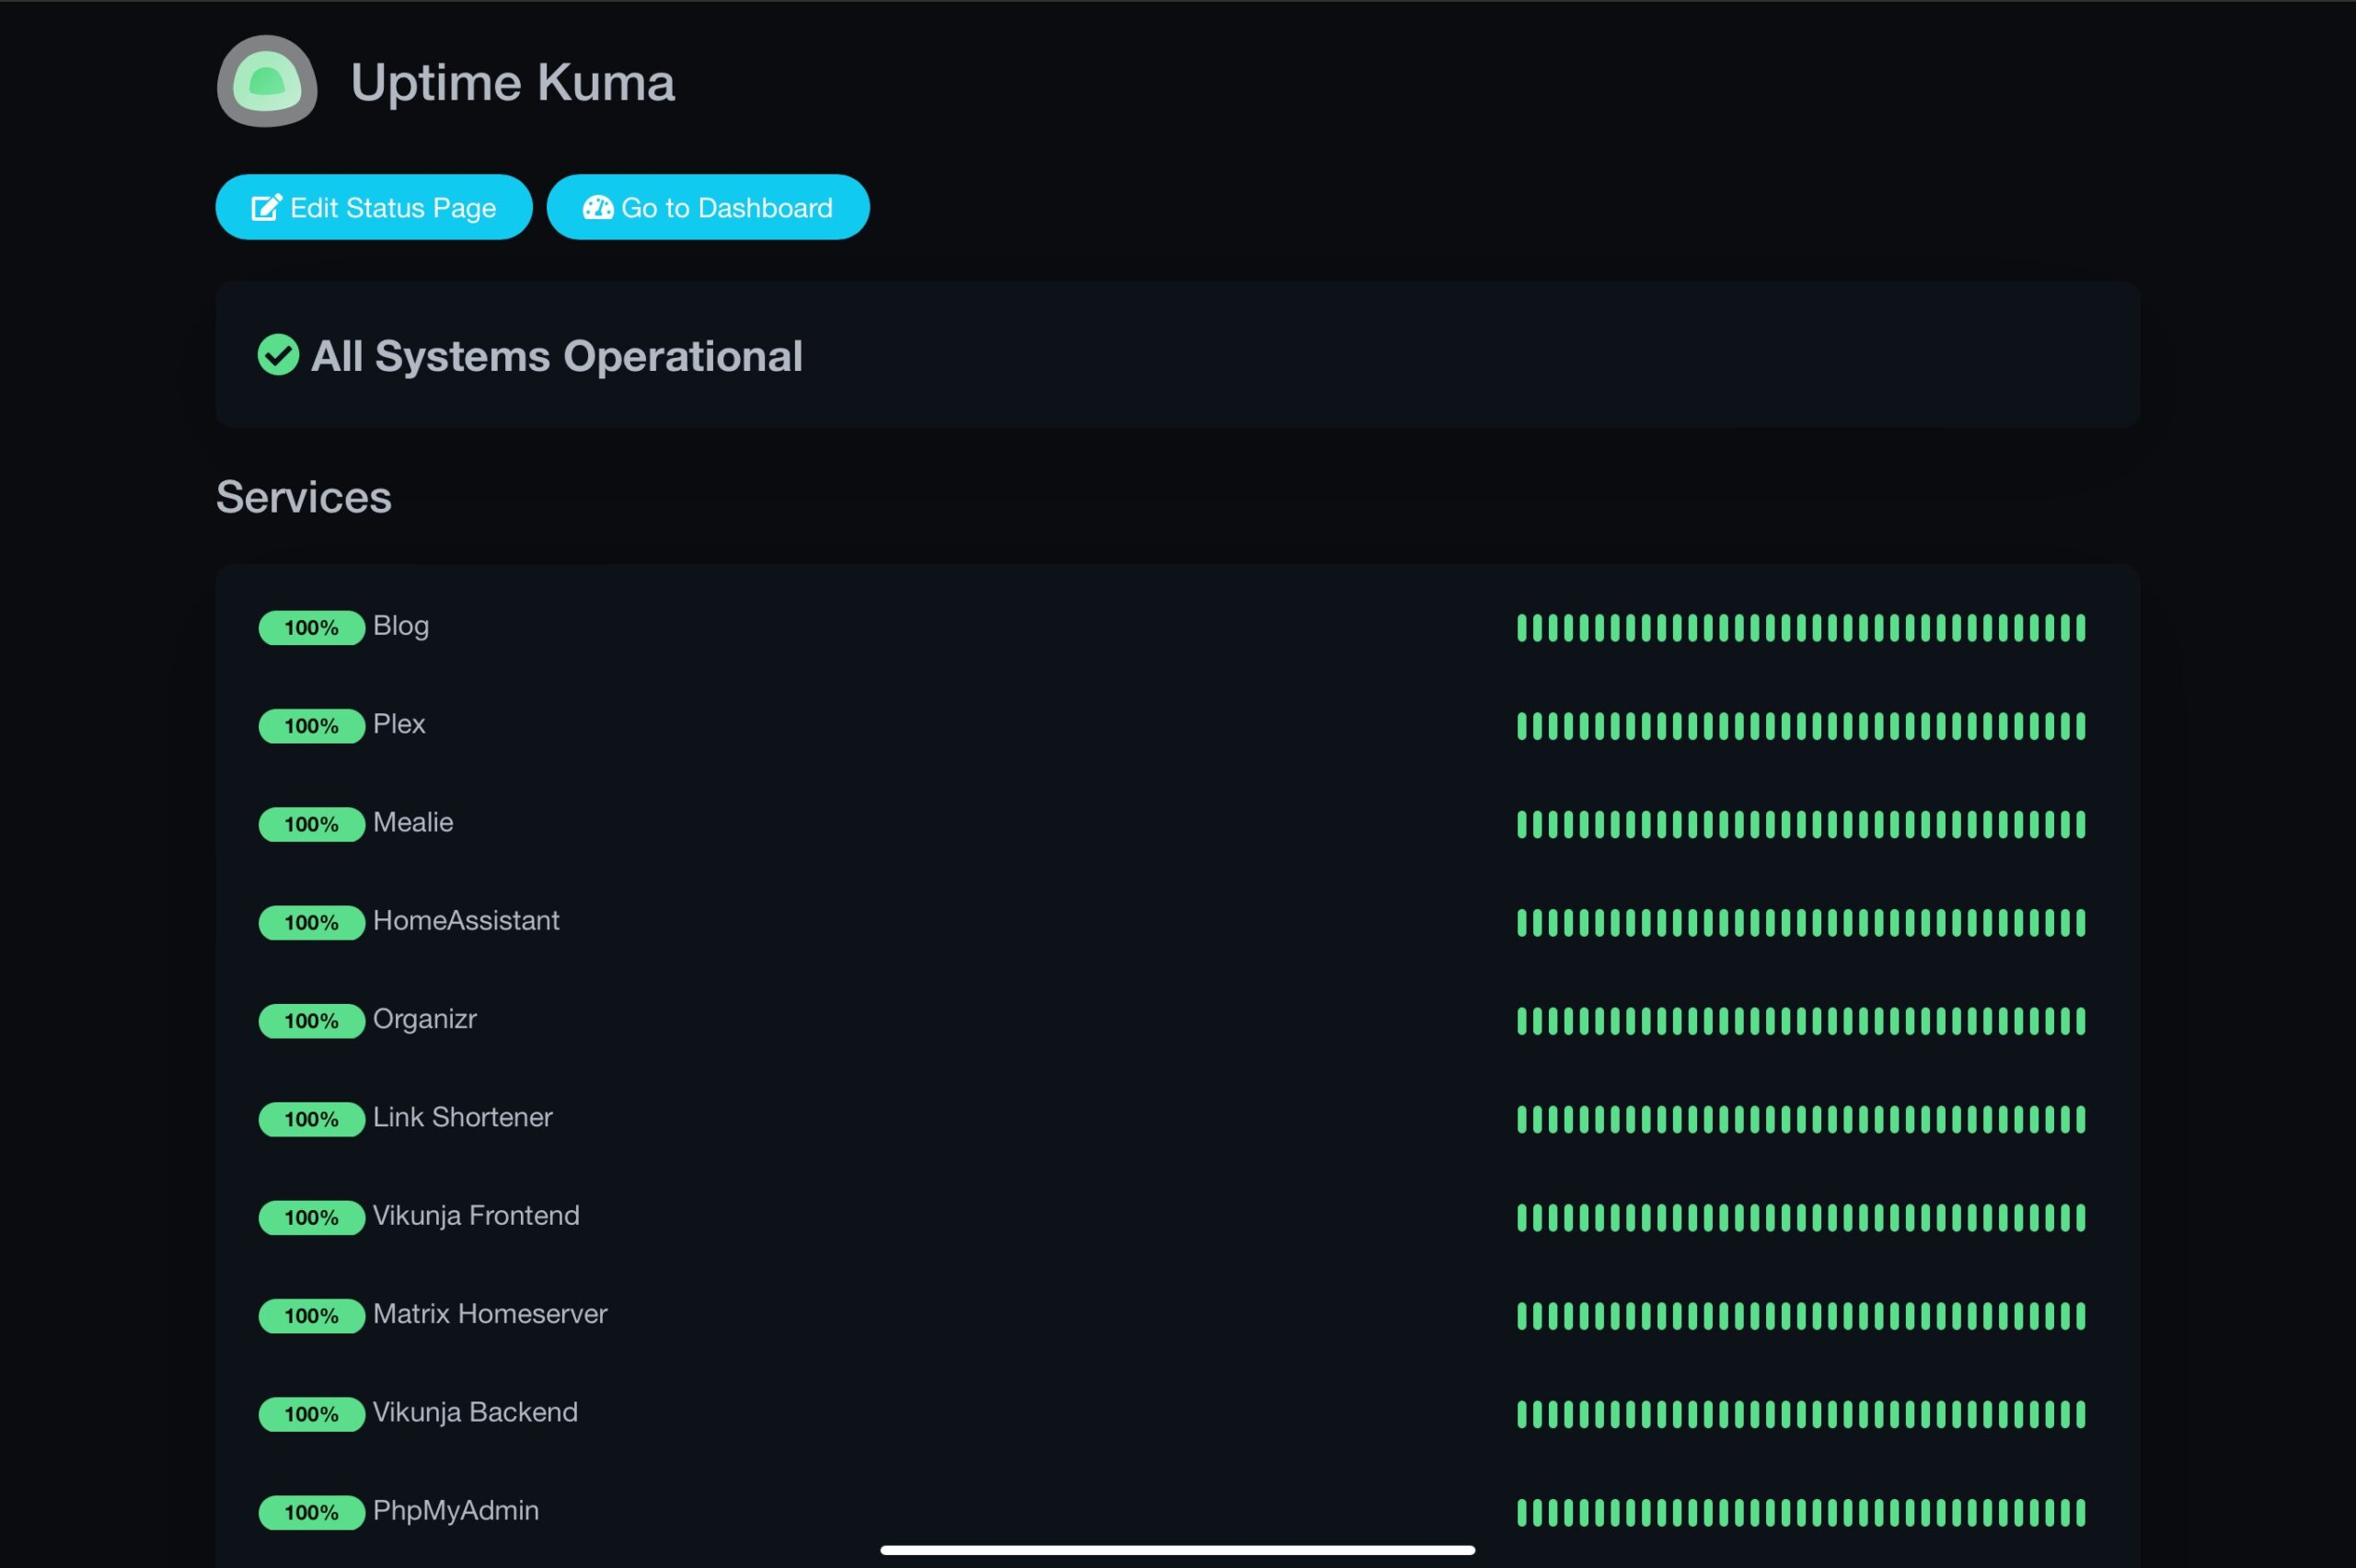
I use an uptime monitoring service called Uptime Kuma to keep track of which which services are currently up. Uptime Kuma is a home-hosted alternative to these cloud services that checks if my web sites are accessible. Every minute, it sends an HTTP GET request to my web services and confirms that there aren’t any access errors. If there are any errors, I have it configured with Mailgun to send me an email. It checks accessibility from the internet, and even sends me a notification when my SSL certificates are about to expire.

Because this is hosted in a docker container, I can isolate it from the rest of my containers. While most of my containers use local DNS through Pi-hole, my Uptime Kuma container uses Cloudflare’s 1.1.1.1 DNS to see what the public internet sees for these sites, including the Cloudflare proxy at the DNS level. If public DNS is misconfigured but local DNS is fine, Uptime Kuma will let me know.
However, this doesn’t solve my power outage problem. If my local internet is down, Uptime Kuma can’t send me emails notifying me that my server is down. It also can’t make public requests if the server itself is the problem rather than the internet. Hosting my uptime checker on the server I’m checking uptime on is a bit of a circular logic problem.
“So I should have just paid for Uptime Robot?”
— Skeptical Home Hosting Enthusiast
Of course not! That’s not the way we do things here at the GrantMcLravy.com blog(TM). I found the Google Cloud free tier. Unlike the AWS EC2 free tier, the Google Compute Engine free tier is always free instead of free for just the first twelve months (until Google decides to change that.)
Google Cloud also includes a free external IPV4 IP, quite a valuable bonus in 2022.
Even though this isn’t exactly home-hosting, it’s still controlling the software stack yourself. The true home-hosting way would be to build a second server at an off-site location, but learning cloud deployment processes is also a valuable skill in today’s IT environment.
I set up the Compute Engine instance as a Ubuntu server instance. I ssh-ed in using the web interface, and set up my standard web-hosting stack:
- Docker and Docker Compose
- MariaDB
- Nginx Proxy Manager
I used my own guide to install all this – part four of this series. The Uptime Kuma install was as easy as adding the following lines to my Docker Compose file:
    uptime-kuma:
    image: louislam/uptime-kuma:1
    container_name: uptime-kuma
    ports:
      - 3001:3001
    dns:
      - "1.1.1.1"
    volumes:
    - uptime-kuma:/app/data
    restart: unless-stopped
volumes:
  uptime-kuma:
I added my IPV4 address for my Google Cloud instance to my Cloudflare DNS records for my domain, set up the reverse proxy settings in Nginx Proxy Manager, and… nothing.
When hosting from home, I needed to open up port 443 in my router settings. Cloud hosting means I don’t control ports at the router level – I have to open the ports in the Compute Engine admin portal. After struggling through the documentation for a little bit, I got port 80 and 443 open, and I was able to access my uptime tracker successfully.
Uptime Kuma allows you to export your database of URLs – this makes creating two duplicate instances very simple. I imported my settings from my existing database, set up notifications, and it was magically set up! To test that it works, I unplugged my home server’s ethernet cable, and waited the 3 minutes for the emails to come through. One set of email notifications for all my services came through. When I plugged my server back in, I got two sets of notifications that everything is back up.
As of right now, when I set up a new app, I have to manually set up both status checkers to include it. Uptime Kuma has an internal API that I might be able to integrate into my app deployment process – there may be a blog post about my API integrations soon(TM).
Uptime monitoring allows me to know immediately when something goes down, but that’s only half the picture. Another future(TM) thing that I’m working on implementing is automatically switching key services to my cloud-hosted EC2 when the local container goes down. There’s quite a bit of groundwork to get that set up, so that might be a farther future type of thing, but it’s in the pipeline.
As always, feel free to reach out if you have any questions or advice for me as I continue through this home-hosting adventure! Contact is the best way to reach me!


